You are viewing **Develocity IntelliJ Plugin 1.0**. To view the latest available version of the docs, see [1.3](https://docs.grdev.net/develocity/intellij-plugin/1.3/).
# Develocity IntelliJ Plugin User Manual
The [Develocity IntelliJ plugin](https://plugins.jetbrains.com/plugin/27471-develocity) seamlessly integrates Develocity and Build Scan capabilities directly into your IDE. It displays a live timeline of task execution and resource usage within your IntelliJ IDE.
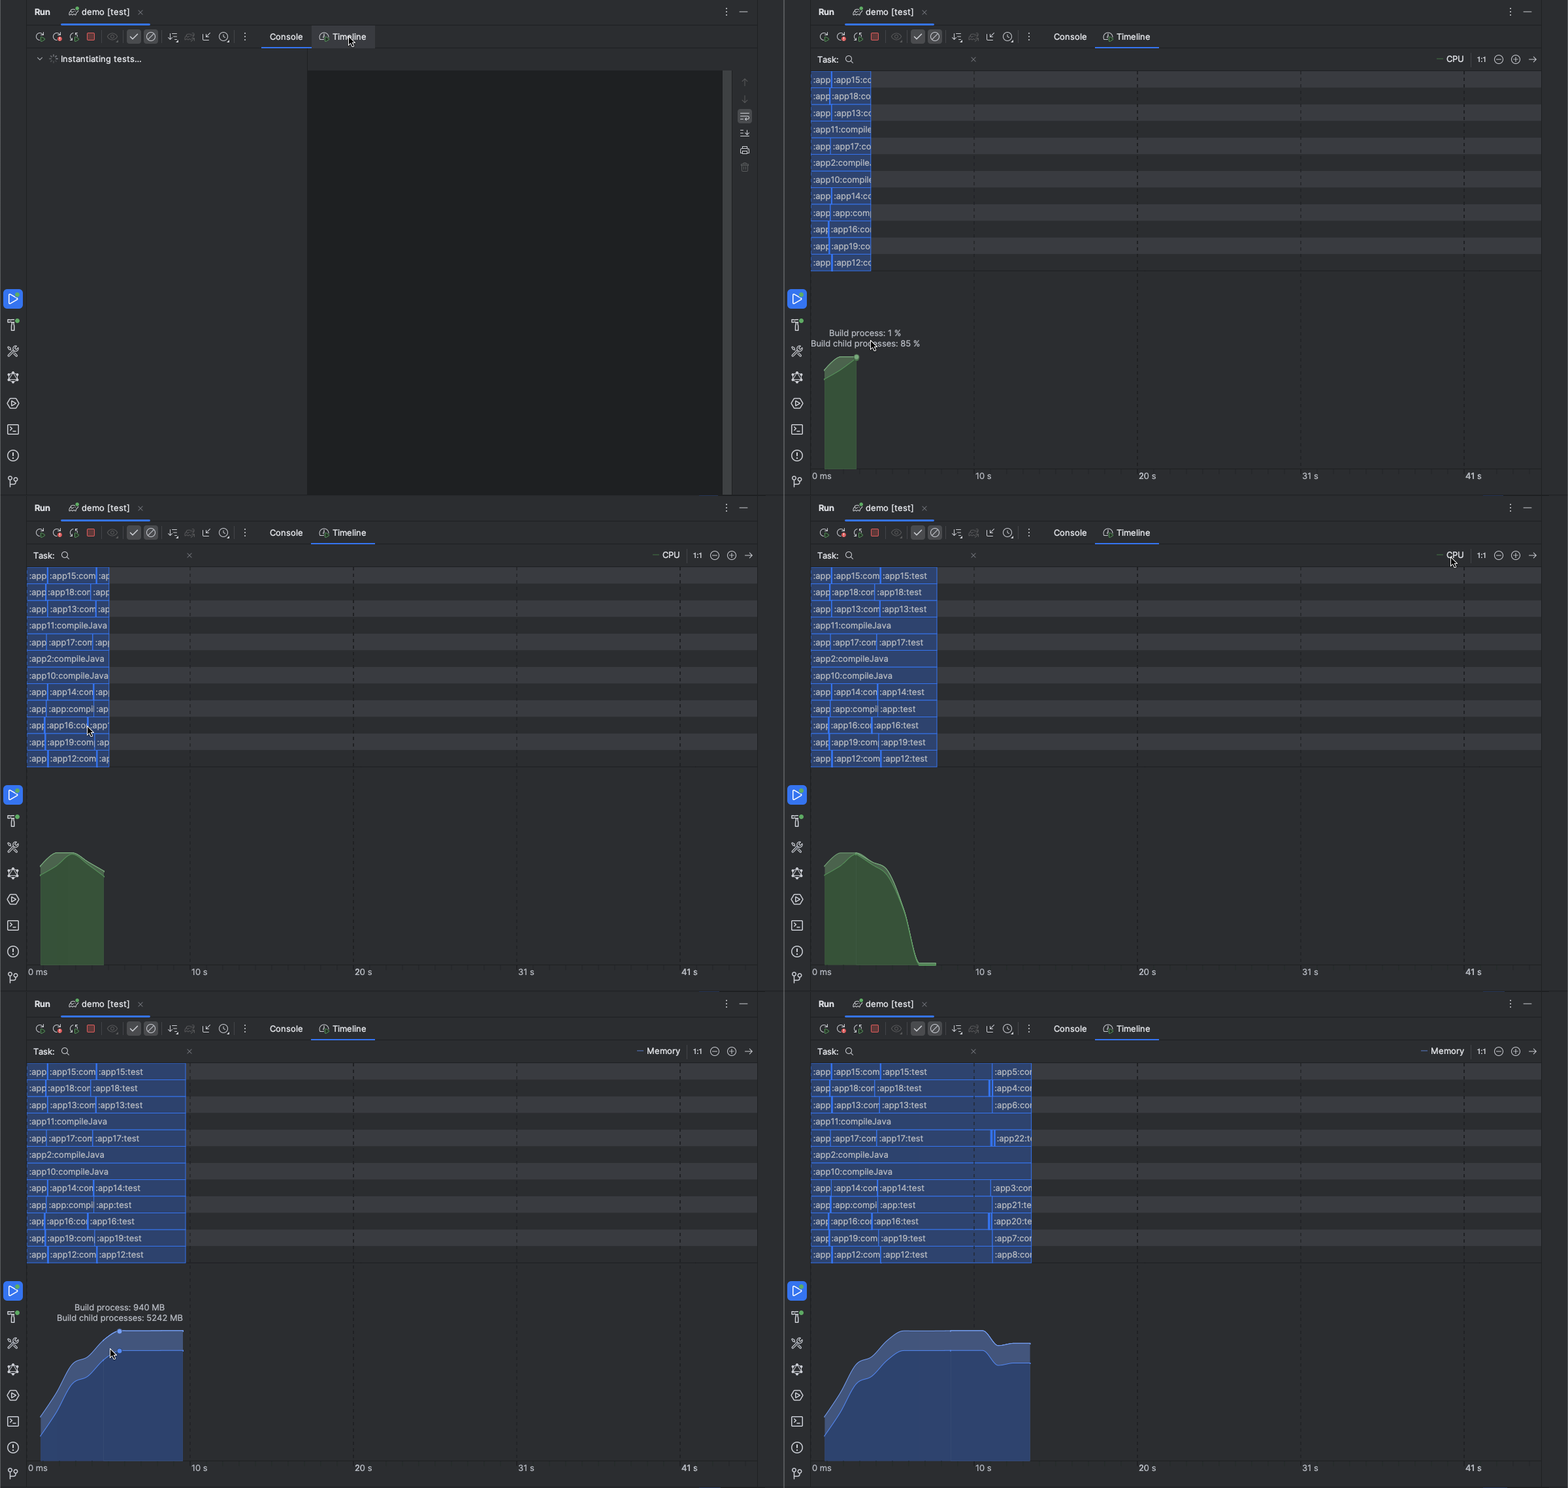
Live Build Timeline
Moreover, it provides a streamlined Develocity configuration for local builds by allowing you to apply and configure the Develocity Gradle plugin to your projects, simplifying the adoption of build performance optimization and troubleshooting.
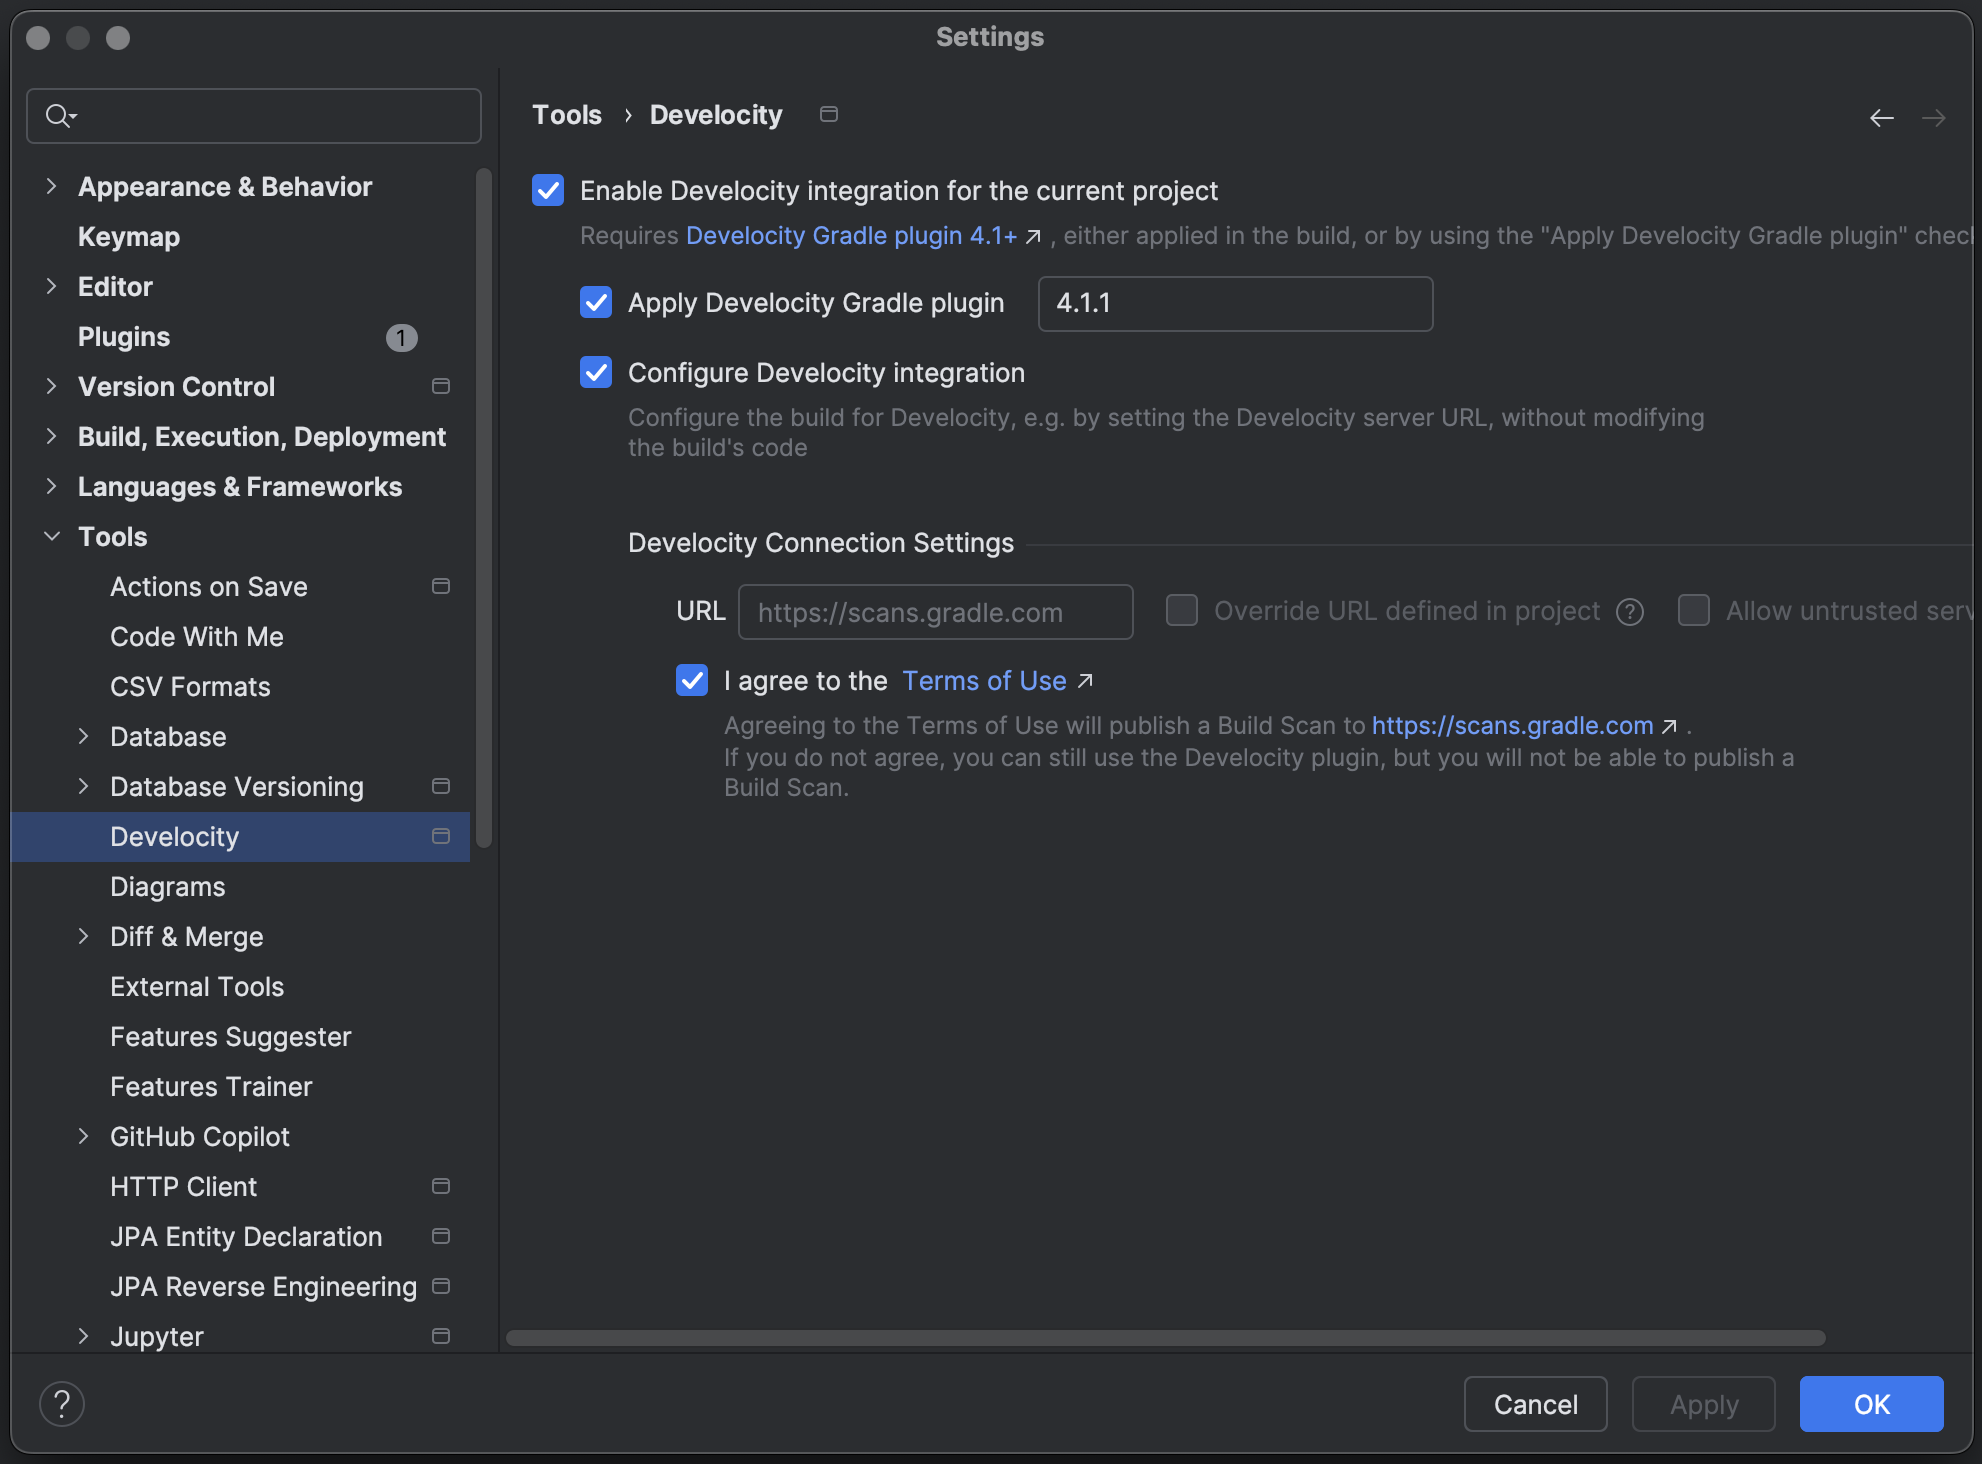
Streamlined Develocity Configuration
## Installation
To install the plugin:
1. Open IntelliJ IDEA.
2. Go to **File** **Settings** (or **IntelliJ IDEA** **Settings** on macOS).
3. Navigate to Plugins.
4. Select the Marketplace tab.
5. Search for "Develocity".
6. Click Install next to the "Develocity" plugin and restart your IDE when prompted.
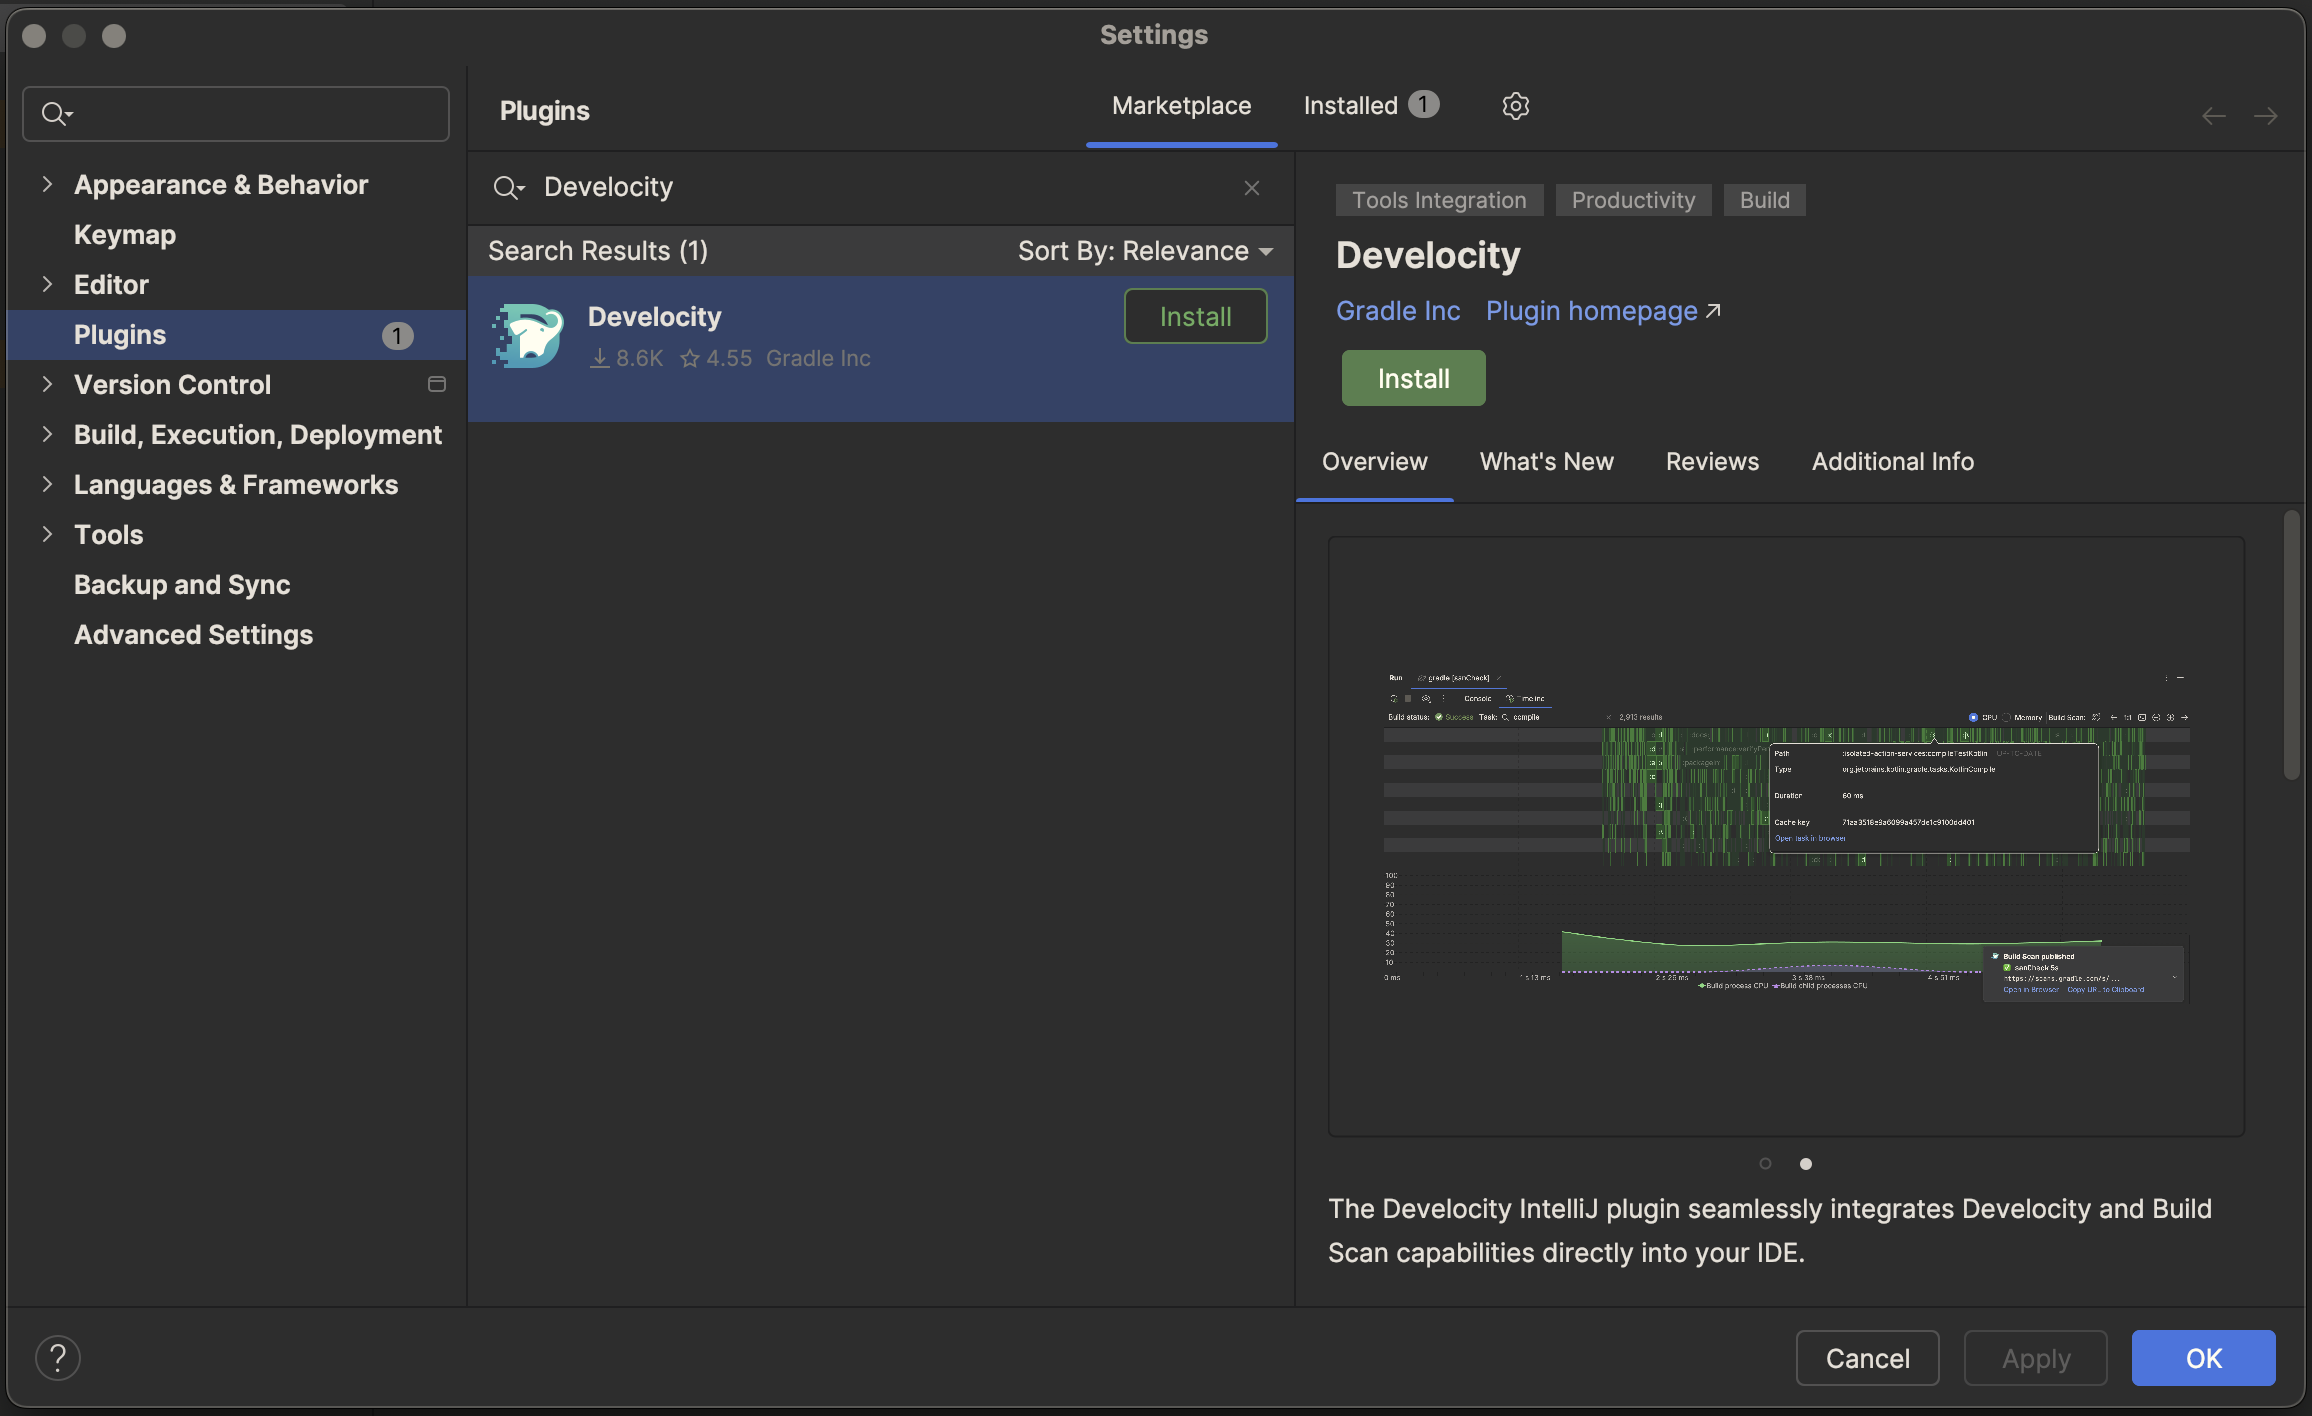
Plugin Installation
## Quick Start
To use the live build timeline, the plugin requires the [Develocity Gradle plugin 4.1](https://plugins.gradle.org/plugin/com.gradle.develocity) or newer to be **manually applied** or **auto-injected** into your Gradle build.
To **manually apply** the Develocity Gradle plugin, add the following to your settings file:
*
Kotlin
*
Groovy
**settings.gradle.kts:**
```
plugins {
id("com.gradle.develocity") version("4.2.2")
}
develocity {
// configuration
}
```
**settings.gradle:**
```
plugins {
id "com.gradle.develocity" version "4.2.2"
}
develocity {
// configuration
}
```
You are now ready to use the plugin.
For additional details on the Develocity Gradle plugin, refer to the [Develocity Gradle Plugin User Manual](https://docs.grdev.net/develocity/gradle/4.4/gradle-plugin/).
If your build doesn’t apply the Develocity Gradle plugin, you can configure [auto-injection](#configuration) right from within IntelliJ.
## Usage
### Live Build Timeline
Start a Gradle build from within IntelliJ IDEs (e.g., Gradle sync, or run a test that delegates to Gradle).
Observe the live timeline and resource graphs appearing directly in your run window (or the build window for Sync).

Plugin Usage
Individual task can be hovered to see more details, such as the task type, duration and potential non-cacheable and out-of-date reasons.
The build phase is displayed and updated while the build is running, with the following values: `Initialization` → `Configuration` → `Execution` → `End of build` → `Success` / `Failed` / `Interrupted`.
### Build Scan publication
_(requires Develocity Gradle plugin 4.1.1+)_
When your build publishes a Build Scan to a Develocity instance, a notification appears in the bottom-right corner of your IDE, allowing you to open the Build Scan in your browser, or copy its URL. You can also access your Build Scan via a button in the timeline view, or directly to a given task via its popup menu.
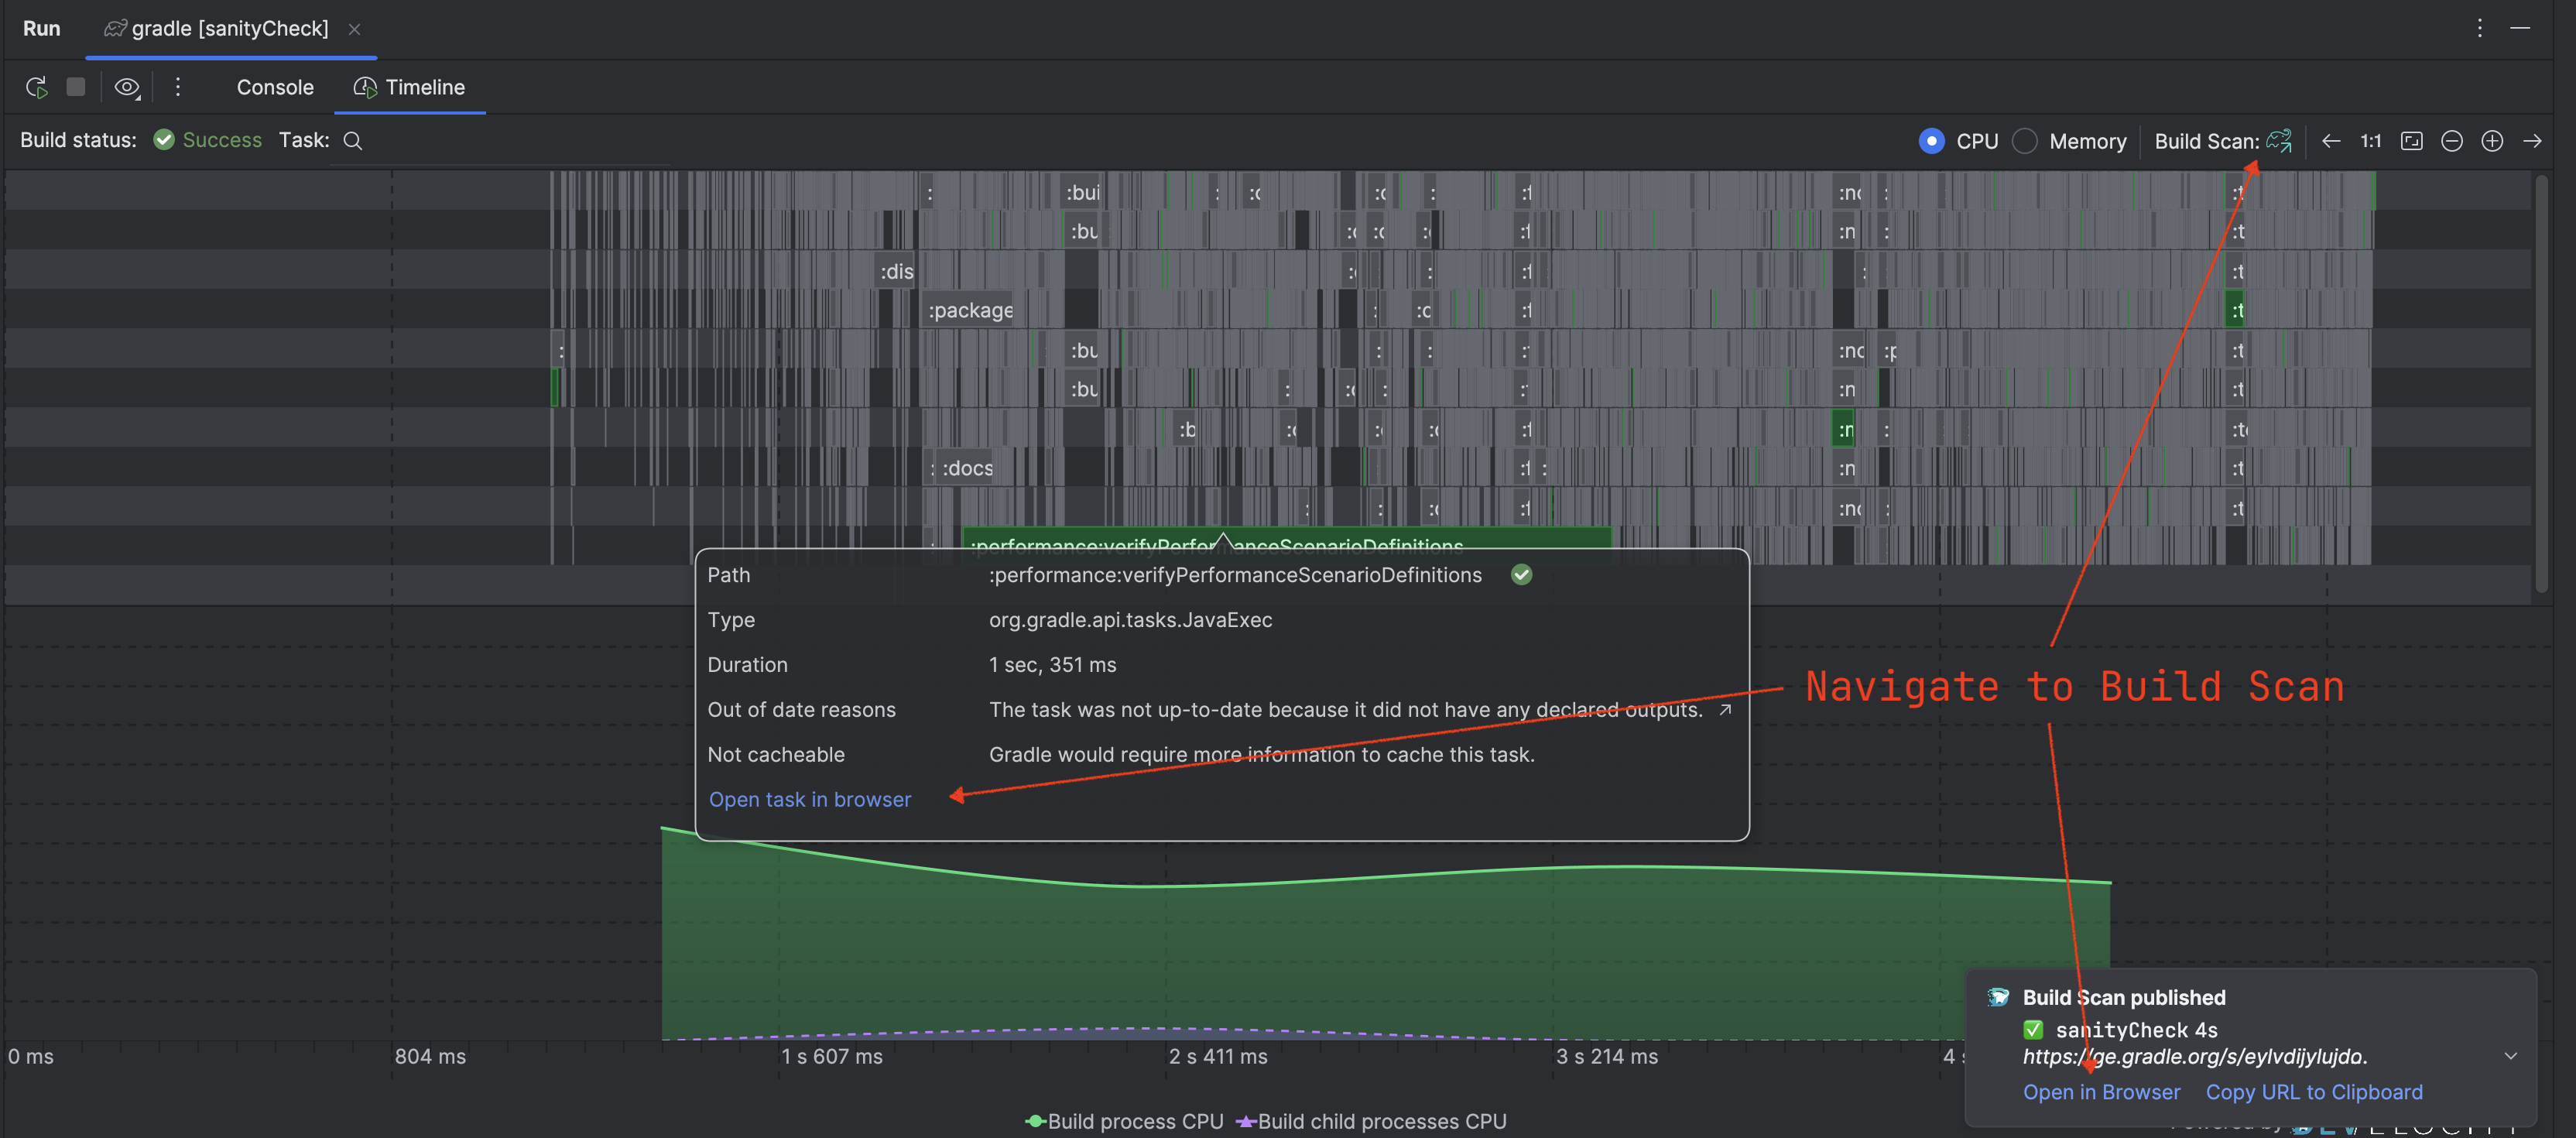
Accessing the published Build Scan for the build
## Configuration
There are three ways to configure this plugin for **auto-injection** (where the [Develocity Gradle plugin](https://plugins.gradle.org/plugin/com.gradle.develocity) is applied for you):
1. Without Build Scan - Reports aren’t published.
2. With Develocity - Reports are published to your Develocity instances.
3. With Develocity at gradle.com - Reports are published to [Develocity at gradle.com](https://gradle.com/scans/gradle/).
Navigate to the settings screen:
1. Go to **File** **Settings** (or **IntelliJ IDEA** **Settings** on macOS).
2. Navigate to **Tools** **Develocity**.
3. Select "Configure Develocity Integration" to enable **auto-injection**

Plugin Configuration
### Without Build Scan
If you don’t want to publish Build Scan reports, simply enable auto-injection and specify the Develocity Gradle plugin version without specifying a server or accepting the terms of use.
### With Develocity
To publish Build Scan reports to an existing Develocity instance, set the server URL to its location and specify the Develocity Gradle plugin version.
If necessary, check [the Gradle plugin user manual](https://docs.grdev.net/develocity/gradle/4.4/gradle-plugin/#authenticating) for instructions on authenticating.
### With Develocity at gradle.com
To publish Build Scan reports to [Develocity at gradle.com](https://gradle.com/scans/gradle/), agree to the [terms of use](https://gradle.com/legal/terms-of-use/) and specify the Develocity Gradle plugin version.
## Troubleshooting
### Live Build Timeline shows no data
* **Symptom:** The timeline view displays a message like "Something went wrong and no data was received from the build."
* **Cause:** The Develocity IntelliJ plugin is not receiving data from the Develocity Gradle plugin. This typically happens if the Gradle plugin version applied to your build is older than 4.1.
* **Solution:** Ensure your build applies Develocity Gradle plugin 4.1 or newer.
### Live Build Timeline is affecting the performance of my machine
* **Symptom:** CPU usage spikes when the timeline view is visible.
* **Cause:** The timeline view might repaint too frequently for the capabilities of your machine.
* **Solution:** Go to **Help** **Find Action**, and type `Registry` to open the IDE registry. Then look for the key `com.gradle.develocity.ide.timeline.refresh.millis`. You can specify any value between 10ms and 5000ms. Try a bigger value to reduce the performance impact of the timeline view.